Many thanks to Shweta J Awhad, whose excellent ‘before’ and ‘after’ VSMs form the case study for this post. Check out her superb blog on IT and project management.
There is no getting away from the fact that, in manufacturing engineering contexts, value stream mapping (VSM) can become obscenely complicated!
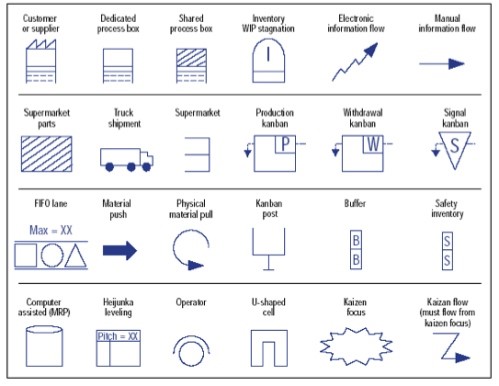
This is because the physical realities of manufacturing, especially high-technology manufacturing, are very complicated. The above table shows the most commonly used symbols in manufacturing VSM, but most of these are not relevant to service and administration contexts. Do you have machinery so costly to run that you have to ensure that it is used absolutely optimally, with routine maintenance planned to the minute? If not, then you don’t need to worry about heijunka levelling. Do you need process kanbans, workitem kanbans and resource kanbans? Unlikely in all but the highest-volume service processes. Do you need to worry about buffer inventory and safety inventory of resources? Possibly, if your work process delivers a ‘service package’ requiring supporting goods (such as domestic rubbish and recycling bins in waste collection).
The point here – applying the ‘parsimony principle’ so beloved of continuous improvement specialists – is that you should only make your value stream map as complicated as it needs to be in order to accomplish its function. A very good example of a simple but powerful value stream map, in both its ‘before’ and ‘after’ versions, is available here at Shweta Awhad’s great blog on IT project management. These VSMs show the application of value stream mapping to a single-purpose call centre dealing with technical problems in B2B after-sales service. The rest of this section will illustrate some key features of VSMs using Shweta’s ‘before’ call centre VSM as an example.
You will note from the ‘before’ map that it reads from left to right in terms of process flow. The map is divided into three main process steps – acknowledge support ticket, process ticket, and resolve ticket – which would correspond to the main process steps described at the bottom of a process SIPOC chart. Each main step is further broken down into discrete activities, denoted by the boxes, for example ‘ticket re-route’, ‘ticket assignment’ and ‘ticket acknowledgement’ within the ‘acknowledge support ticket’ step.
Each process activity box contains four pieces of information:
- Processing time (P/T). This is simply the average amount of time required for each activity to be performed, per workitem (the workitems are service instances represented by support tickets, in this case). This includes ‘touch time’ – the time that the workitem is being worked on by the operator – as well as ‘think time.’ It does not include ‘wait time’ – this is the amount of time spent by a workitem in a single queue before it reaches the operator. You will see from the ‘before’ map of the call centre that queues are denoted separately using the intray icons, which is probably the right thing to do in this map, as it needs to emphasize the problematic nature of queues in this process. ‘Cycle time’, a metric which is not included in this call-centre VSM, equals processing time + wait time.
- Downtime (D/T). This is the amount of time for which a particular process activity cannot take place during the working day, for any reason. It is calculated on a per-workitem basis.
- Percentage complete and accurate (%CA). This is the proportion of workitems which are not returned for rework by the downstream operator as a result of incorrect, missing or ambiguous information, or deficient resources. It is a measure of reliability in a process activity (care is needed here – it is not a measure of an individual’s reliability. Even in process activities which are habitually carried out by the same individual employee, it is almost always the setup and management of the process itself which is responsible for the reliability characteristics of a process activity!).
- Operator identity. This is denoted by the bottom, coloured, line of the box, in which the operator symbol is accompanied by the name of the responsible team or individual. Note that the operator is not necessarily the owner of the activity – it is just the role or team which does the activity in question.
In the top left of the process map, the ‘summary data’ box shows the total processing time for the entire process, as well as the total leadtime (L/T). Leadtime is expressed as processing time plus downtime. Essentially, it expresses the amount of time that a workitem will spend at each process activity. The total leadtime for process is a useful metric, as it expresses the total time that a work item will spend in the process, from beginning to end. You will note that within the particular call centre VSM we are using as an example, waiting time is expressed as leadtime. The three rows at the bottom of the VSM usefully summarize the processing time, leadtime and percentage complete and accurate for each process activity.
Finally, the ‘before’ VSM for the call centre also shows where waste occurs. As is usual in value stream mapping for Lean Six Sigma, ‘waste’ is categorized in eight ways, all of which have great relevance to understanding a process.